By: Raymund Santos, Senior Manager, Quality Control Bioanalytics, AGC Biologics
Aelén Mabillé, Manager, Quality Control Raw Materials, AGC Biologics
Self-identified quality improvements
In the pharmaceutical quality environment, change is often reactive, driven by unfavorable events like deviations, equipment failure, or health authority observations. While many firms use Right First Time (RFT) initiatives to minimize errors, these are frequently corrective rather than purposeful. However, recent experience proves that self-identified compliance improvements are far more powerful. Proactively addressing potential issues can eliminate formal observations or reduce them to recommendations, assuring inspectors of a firm’s robust culture of continuous improvement.
Cost of improving
A common roadblock to change is resources, but not all process improvements require significant new investment. A dedicated Operational Excellence (OE) team or Lean Six Sigma (LSS) project is not a prerequisite for meaningful change. In a quality-driven culture, firms can maximize the utility of existing business tools and processes to self-identify opportunities for improving quality and compliance.
The baseline: What must be fixed? How do we fix it?
Error minimization and prevention are the low-hanging fruit of process improvement, yet they are often overlooked. Experience shows that errors typically stem from procedural inefficiencies or a lack of clarity, not deliberate non-compliance. While common indicators like invalid assay rates or human error root causes are useful for summarizing outcomes, they are often underutilized for prevention. To intercept errors before they impact RFT statistics, the Quality Control (QC) laboratory utilized the Error Efficiency Ratio (EER), a measure of a weighted error score relative to the aggregate data output:
Total Error Score / Total Number of Reviewed Assays
To implement this, laboratory errors material to data integrity were stratified and assigned error codes based on criticality: Critical, Major, Moderate, and Minor (Figure 1).
Figure 1. Error code classification.
Using existing business tools, errors were tracked during routine data review to establish a baseline over one quarter (Figure 2).
Figure 2. Error code frequency distribution.
The baseline EER for one quarter of reviewed data was calculated to be 0.34, indicating that an error of some kind was present in 34% of all data generated by the team. This figure was derived from a total error score of 517 divided by 1,507 total reviewed assays.
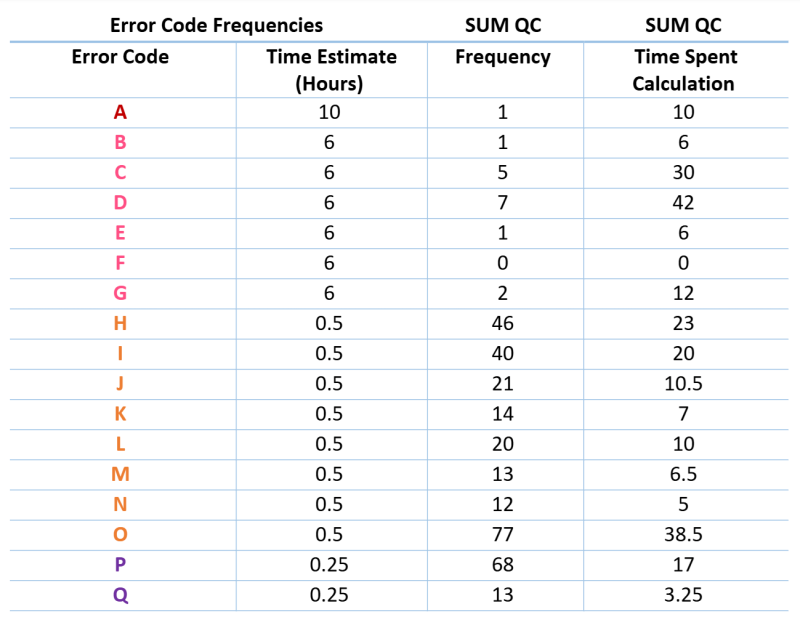
To transform the EER from a simple statistic into a true efficiency indicator, the error codes were then correlated to the FTE hours required to correct them (Figure 3). This analysis confirmed what the stratification suggested: error codes classified as Critical or Major were not only the highest risk from a quality perspective but also consumed the most resources to remediate.

Figure 3. FTE hours required for remediation.
Data Analysis
This data provided clear insight to answer two key questions: What were the most common errors analysts made, and how much time did the team spend remediating them?
Further analysis of the data revealed several key deductions:
Most errors made during the baseline period were Moderate to Minor in classification. As a quality pulse check, this data provided assurance that most errors occurring throughout the data generation lifecycle were of low risk.
The most frequent errors were Transcription and Typographical mistakes. This data led to a deeper assessment of various factors: Was a specific team a frequent offender? Was a particular method or process generating the most errors? Was there a common, recurring mistake that could be easily addressed?
The most significant resources were spent on the remediation of errors classified as Major. This was not a surprise, as both Critical and Major errors required, in almost every case, a complete repeat of the task, leading to lost time, materials, and potential delays.
Corrective Actions
This detailed analysis led directly to effective corrective actions. It was discovered that a certain process had changed in a specific QC area, which resulted in a subtle but crucial change in documentation requirements. This single issue was identified as the root cause for an error that occurred eleven times in the first quarter. The error type was brought to the attention of team members during regular team meetings. In the 30 days following this simple corrective action—awareness training—the error was reduced to just one occurrence. This powerful result, achieved with minimal resources, showed how data evaluation, targeted communication, and the right mindset for change allowed the team to course-correct and reduce the error frequency to nearly zero.
Conclusion
The visibility of the real-time EER indicators to both management and floor staff encouraged collaborative and innovative approaches to correcting these self-identified opportunities for improvement. By empowering the team with data, the organization fostered a culture where improvement was not a top-down mandate but a shared responsibility. Fostering this type of improvement-driven culture creates a virtuous cycle of quality, where proactive problem-solving becomes the norm. Ultimately, the winners are the patients who rely on a steady supply of treatments delivered with the highest possible quality.